The Seven Bridges of Königsberg
Is there a walk through Königsberg that crosses each of its seven bridges exactly once? The city lay on both banks of the river Pregel and on two islands, Kneiphof and Lomse, joined to each other and to the banks by seven bridges. Leonhard Euler showed that no such walk exists, and his argument laid the foundations of graph theory. The shape of the map does not matter, only how many bridges each piece of land has. A walk that enters a piece of land has to leave it again, so every piece but the first and the last needs an even number of bridges. Kneiphof had five bridges, and each of the other three pieces had three.
The general rule is known as Euler’s criterion. A connected graph has a walk that uses every edge exactly once if and only if zero or two of its nodes have an odd number of edges. With zero, the walk ends where it started, and with two, it runs from one of them to the other. Euler stated the rule, and Carl Hierholzer proved that the condition is enough.
The example draws a map of the city, reads the graph from which land each bridge reaches, and checks the criterion for the seven bridges and for the five that stand at the old sites today.
This page is part of a collection of geometry and design examples using planex2d.
Open this example in the playground, the interactive code editor in the browser, to change the code and run it.

[1]:
from collections import Counter

import planex as px
The map
The map is a box of 120 × 70. The river comes in from the west, widens into a basin around Kneiphof and leaves to the east in two arms, with Lomse between them. The water is the union of four rectangles, less Kneiphof, a slot 22 long and 10 wide in the basin. The land is the box less the water, and it falls apart into four faces, the four pieces of land (Figure 1a):
[3]:
box = px.QuickSketch().Rectangle(120, 70).Face()
river = px.Unify([px.QuickSketch((0, 30)).Rectangle(30, 10).Face(),
                  px.QuickSketch((26, 22)).Rectangle(32, 26).Face(),
                  px.QuickSketch((56, 42)).Rectangle(64, 6).Face(),
                  px.QuickSketch((56, 22)).Rectangle(64, 6).Face()])
kneiphof = px.QuickSketch((36, 35)).Slot(12, 10).Face()
water = river - kneiphof
land = box - water
print(len(land.faces), "pieces of land")
# px.Plot(land)
4 pieces of land
A point inside each piece names it:
[4]:
places = {"Kneiphof": (42, 35), "Lomse": (90, 35), "north bank": (60, 60), "south bank": (60, 10)}
pieces = {name: next(px.Face(f) for f in land.faces if px.Face(f).Contains(p)) for name, p in places.items()}
for name, piece in pieces.items():
    print(name, "area", piece.mass)
Kneiphof area 198.53981633974485
Lomse area 868.0
north bank area 2848.0
south bank area 2848.0
The graph
A bridge is a rectangle across the water that reaches onto the land at both ends. Overlaps tells which pieces of land it reaches, and these two pieces are the ends of its edge in the graph (Figure 1b). Two bridges each run from Kneiphof to the north bank and to the south bank, and one each from Lomse to Kneiphof and to both banks:
[5]:
bridges = {"Kneiphof-north 1": ((38, 44), 3, 10), "Kneiphof-north 2": ((46, 44), 3, 10),
           "Kneiphof-south 1": ((38, 26), 3, 10), "Kneiphof-south 2": ((46, 26), 3, 10),
           "Kneiphof-Lomse": ((55.5, 35), 9, 3), "north-Lomse": ((80, 45), 3, 8), "south-Lomse": ((80, 25), 3, 8)}
spans = {name: px.QuickSketch().RectangleC(center, w, h).Face() for name, (center, w, h) in bridges.items()}
edges = {name: [p for p, piece in pieces.items() if span.Overlaps(piece)] for name, span in spans.items()}
for name, ends in edges.items():
    print(name, "joins", ends)
degree = Counter(p for ends in edges.values() for p in ends)
print("bridges per piece", dict(degree), "| odd:", sum(d % 2 for d in degree.values()))
# px.Plot(px.Compound([land, *spans.values()]))
Kneiphof-north 1 joins ['Kneiphof', 'north bank']
Kneiphof-north 2 joins ['Kneiphof', 'north bank']
Kneiphof-south 1 joins ['Kneiphof', 'south bank']
Kneiphof-south 2 joins ['Kneiphof', 'south bank']
Kneiphof-Lomse joins ['Kneiphof', 'Lomse']
north-Lomse joins ['Lomse', 'north bank']
south-Lomse joins ['Lomse', 'south bank']
bridges per piece {'Kneiphof': 5, 'north bank': 3, 'south bank': 3, 'Lomse': 3} | odd: 4
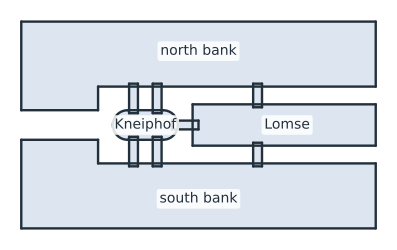
(a) Four pieces of land and seven bridges
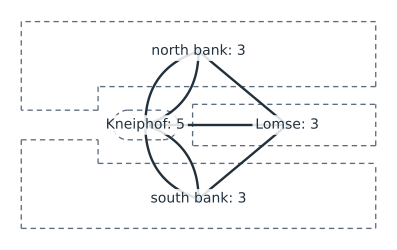
(b) The graph: the bridges per piece
All four pieces have an odd number of bridges, so by Euler’s criterion no walk crosses every bridge exactly once.
The bridges today
Two of the seven bridges did not survive the bombing of the Second World War, and two more were later replaced by a highway at the same sites. Five bridges stand at the old sites, one from Kneiphof to each bank and the three to Lomse. Now only the two islands have an odd number of bridges, so a walk exists, and it has to run from one island to the other.
Hierholzer’s algorithm finds it. It walks from the start over bridges not yet crossed until it gets stuck, then backs up to the last piece of land with a bridge left and inserts the detour from there. The walk below starts on Kneiphof (Figure 2):
[7]:
today = {name: ends for name, ends in edges.items() if name not in ("Kneiphof-north 2", "Kneiphof-south 2")}
degree_today = Counter(p for ends in today.values() for p in ends)
print("bridges per piece today", dict(degree_today))


def euler_walk(edges, start):
    """a walk over every edge {name: (a, b)} exactly once from start (Hierholzer), as the edges' names in order"""
    left, stack, walk = dict(edges), [(start, None)], []
    while stack:
        here, via = stack[-1]
        out = next((name for name, ends in left.items() if here in ends), None)
        if out is None:
            walk.append(via)
            stack.pop()
        else:
            a, b = left.pop(out)
            stack.append((b if a == here else a, out))
    return [name for name in reversed(walk) if name is not None]


walk = euler_walk(today, "Kneiphof")
here = "Kneiphof"
for name in walk:
    a, b = today[name]
    here = b if a == here else a
    print(name, "to", here)
print("every bridge once:", sorted(walk) == sorted(today), "| ends on", here)
# px.Plot(px.Compound([land, *[spans[name] for name in today]]))
bridges per piece today {'Kneiphof': 3, 'north bank': 2, 'south bank': 2, 'Lomse': 3}
Kneiphof-north 1 to north bank
north-Lomse to Lomse
Kneiphof-Lomse to Kneiphof
Kneiphof-south 1 to south bank
south-Lomse to Lomse
every bridge once: True | ends on Lomse
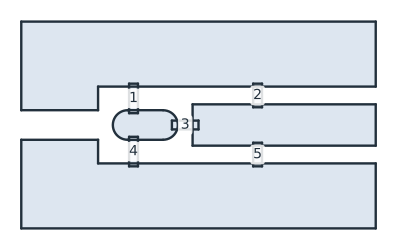
The walk ends on Lomse, the other island with an odd number of bridges. See Relations between shapes for Overlaps and the other relations, and Squaring the square for another graph read from a drawing.