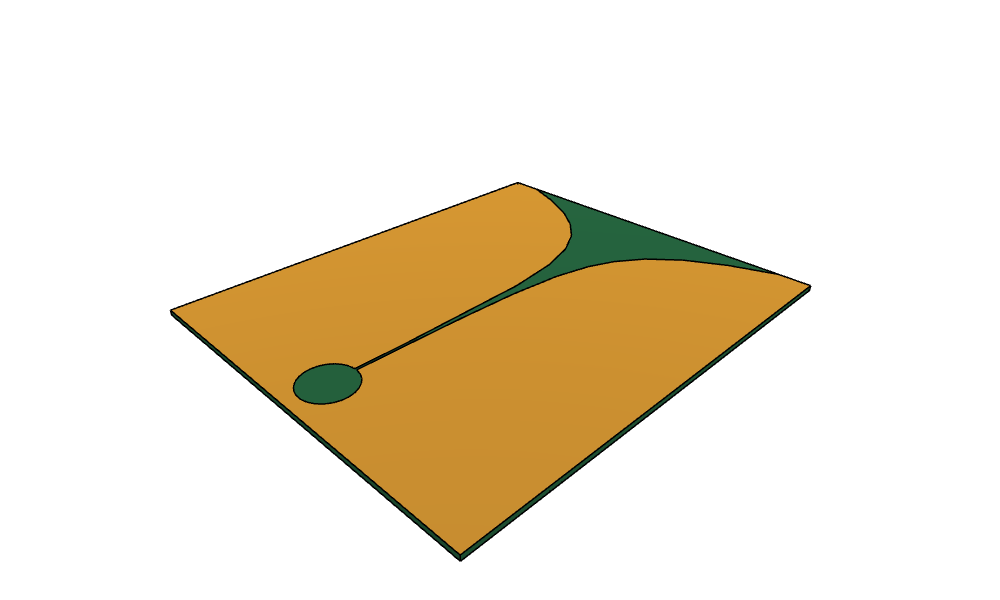
Vivaldi tapered slot antenna
The example is a tapered slot antenna on a 70 × 60 board of Rogers 4003 (εr = 3.55, 0.8 mm). The slot in the top copper opens exponentially towards the edge of the board, from 0.4 to 50, and behind it, a round cavity ends the slot line. On the back, a microstrip line crosses the slot and ends in a radial stub. Lengths are in mm.

[1]:
import math
import matplotlib.pyplot as plt
import netgen.occ as occ
from ngsolve_webgpu.jupyter import Draw
import planex as px
The dimensions
Parameter |
|
|---|---|
|
The board, 70 × 60 and 0.8 thick |
|
The cavity’s center at x = 6 and its diameter of 8 |
|
The flare runs from x = 18 to the edge of the board at x = 70 |
|
The slot’s width of 0.4 and the aperture of 50 at the edge |
|
The flare’s rate R in y = c1 exp(R x) + c2, 0.12 per mm |
|
The microstrip line at x = 13, 1.8 wide |
|
The radial stub’s center at y = 4 and its radius of 6 |
[3]:
board_l = 70.0
board_w = 60.0
h = 0.8
x_cavity = 6.0
d_cavity = 8.0
x0 = 18.0
x1 = 70.0
slot = 0.4
aperture = 50.0
rate = 0.12
x_feed = 13.0
w_feed = 1.8
y_stub = 4.0
r_stub = 6.0
The flare
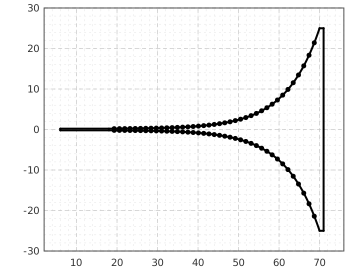
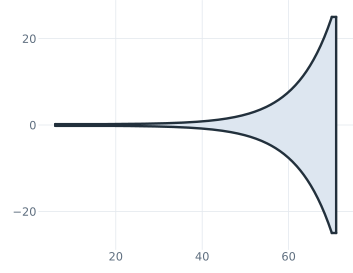
The flare follows y = c1 exp(R x) + c2 through the slot width at x0 and the aperture at the edge of the board, drawn as a spline through 41 points of the curve. The opening runs from the cavity along the slot, out along the flare, 1 beyond the edge of the board, and back (Figure 1).
[4]:
e0, e1 = math.exp(rate * x0), math.exp(rate * x1)
c1 = (aperture / 2 - slot / 2) / (e1 - e0)
c2 = (slot / 2 * e1 - aperture / 2 * e0) / (e1 - e0)


def flare(x):
    return c1 * math.exp(rate * x) + c2


xs = [x0 + (x1 - x0) * k / 40 for k in range(41)]
opening = px.QuickSketch((x_cavity, slot / 2)).Line((x0, slot / 2)).Spline([(x, flare(x)) for x in xs[1:]])
opening.Line((x1 + 1, aperture / 2)).Line((x1 + 1, -aperture / 2)).Line((x1, -aperture / 2))
opening.Spline([(x, -flare(x)) for x in reversed(xs[:-1])]).Line((x_cavity, -slot / 2)).Close()
[4]:
Top copper and feed
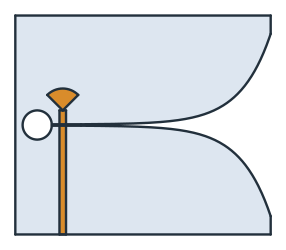
The top copper is the board minus the opening and the cavity. The feed on the back is the microstrip line from the lower edge of the board to the stub’s center, plus the stub, a quarter circle turned by 45° (Figure 2).
[6]:
board = px.QuickSketch((0, -board_w / 2)).Rectangle(board_l, board_w).Face()
cavity = px.QuickSketch().Circle(x_cavity, 0, d_cavity / 2).Face()
copper = px.Subtract([board, opening.Face(), cavity])

line = px.QuickSketch((x_feed - w_feed / 2, -board_w / 2), dir=(1, 0)).Rectangle(w_feed, board_w / 2 + y_stub).Face()
a = math.radians(45)
stub = px.QuickSketch((x_feed, y_stub)).Line((x_feed + r_stub * math.cos(a), y_stub + r_stub * math.sin(a)))
stub = stub.Arc(center=(x_feed, y_stub), sweep=90).Close().Face()
feed = line + stub
Check
Checks:
the flare, cut off from the slot line with
Trim, has the area of the integral of the curve;the copper leaves the aperture of 50 open on the edge of the board, which sets the lowest frequency at about c / (2 aperture).
[8]:
taper = (board * opening.Face()).Trim(px.Line((x0, -40), (x0, 40)), keep_largest=True)
exact = 2 * (c1 / rate * (e1 - e0) + c2 * (x1 - x0))
print("flare", taper.mass, "exact", exact, "relative difference", f"{(taper.mass - exact) / exact:.1e}")
edge = sum(e.mass for e in copper.edges if abs(e.start.h - x1) < 1e-9 and abs(e.end.h - x1) < 1e-9)
print("aperture", board_w - edge, "lowest frequency about", round(299.792458 / (2 * aperture), 2), "GHz")
flare 429.0959895491084 exact 429.09444085648624 relative difference 3.6e-06
aperture 50.0 lowest frequency about 3.0 GHz
The board
The substrate is the board extruded to its thickness, with the copper on top and the feed below:
[9]:
copper.name = "copper"
feed.name = "feed"
substrate = board.ToOCCFace().Extrude(h)
model = occ.Glue([substrate, copper.Translated((0, 0, h)).ToOCCShape(), feed.ToOCCShape()])
model.faces.col = (0.15, 0.40, 0.25)
for name in ("copper", "feed"):
    model.faces[name].col = (0.85, 0.60, 0.20)
Draw(model)